What-If Analysis, Charting, And Working With Large Worksheets Page 80
ADVERTISEMENT
 1
1 2
2 3
3 4
4 5
5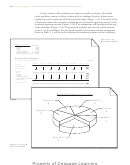 6
6 7
7 8
8 9
9 10
10 11
11 12
12 13
13 14
14 15
15 16
16 17
17 18
18 19
19 20
20 21
21 22
22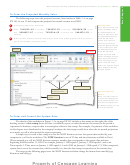 23
23 24
24 25
25 26
26 27
27 28
28 29
29 30
30 31
31 32
32 33
33 34
34 35
35 36
36 37
37 38
38 39
39 40
40 41
41 42
42 43
43 44
44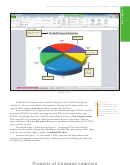 45
45 46
46 47
47 48
48 49
49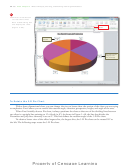 50
50 51
51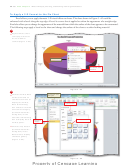 52
52 53
53 54
54 55
55 56
56 57
57 58
58 59
59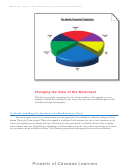 60
60 61
61 62
62 63
63 64
64 65
65 66
66 67
67 68
68 69
69 70
70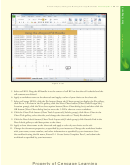 71
71 72
72 73
73 74
74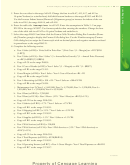 75
75 76
76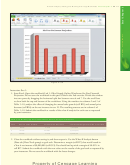 77
77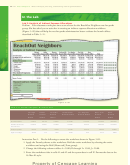 78
78 79
79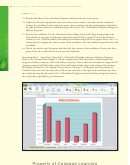 80
80 81
81 82
82 83
83 84
84 85
85 86
86 87
87EX 216
Excel Chapter 3
What-If Analysis, Charting, and Working with Large Worksheets
continued
In the Lab
13. Rename the Sheet1 sheet as Indirect Expenses Analysis and color its tab green.
14. Update the document properties with your name, course number, and name for the workbook.
Change the worksheet header with your name, course number, and other information as specifi ed
by your instructor. Save the workbook using the fi le name, Lab 3-2 ReachOut Neighbor Analysis of
Indirect Expenses.
15. Preview the worksheet. Use the Orientation button (Page Layout tab | Page Setup group) to fi t
the printout on one page in landscape orientation using the Fit to option. Preview the formulas
ctrl
ctrl
version (
+`) of the worksheet in landscape orientation using the Fit to option. Press
+` to
instruct Excel to display the values version of the worksheet. Save the workbook again and close the
workbook.
16. Divide the window into four panes and show the four corners of the worksheet. Remove the four
panes. Close the workbook but do not save the workbook.
Instructions Part 2: Start Excel. Open Lab 3-2 ReachOut Neighbor Analysis of Indirect Expenses.
Draw a 3-D Column Chart (Figure 3 – 90) on a separate sheet that shows the contribution of each
category of indirect expense to the total indirect expenses. That is, chart the nonadjacent ranges A8:A13
(category names) and I8:I13 (data series). Show labels that include value of the column. Do not show
the legend. Format the 3-D Column Chart as shown in Figure 3–90. Rename the chart sheet 3-D
Column Chart and color the sheet tab red. Move the chart tab to the right of the worksheet tab. Save
the workbook using the fi le name, Lab 3-2 ReachOut Neighbor Analysis of Indirect Expenses. Submit
the workbook as specifi ed by your instructor.
Figure 3 – 90
ADVERTISEMENT
0 votes
Related Articles
Related forms


Related Categories
Parent category: Education