What-If Analysis, Charting, And Working With Large Worksheets Page 73
ADVERTISEMENT
 1
1 2
2 3
3 4
4 5
5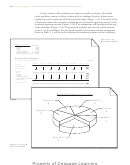 6
6 7
7 8
8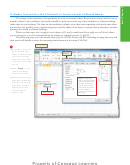 9
9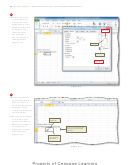 10
10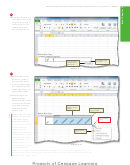 11
11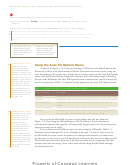 12
12 13
13 14
14 15
15 16
16 17
17 18
18 19
19 20
20 21
21 22
22 23
23 24
24 25
25 26
26 27
27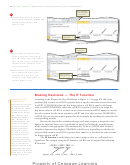 28
28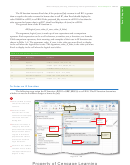 29
29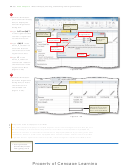 30
30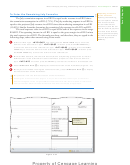 31
31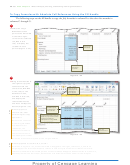 32
32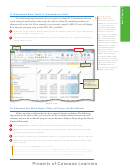 33
33 34
34 35
35 36
36 37
37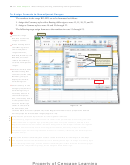 38
38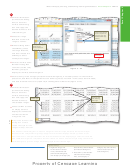 39
39 40
40 41
41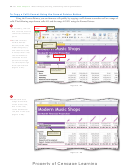 42
42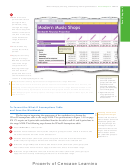 43
43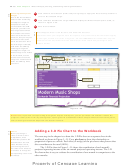 44
44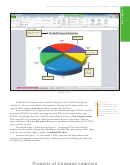 45
45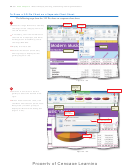 46
46 47
47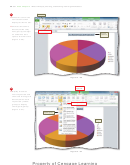 48
48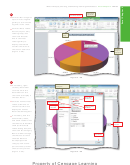 49
49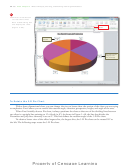 50
50 51
51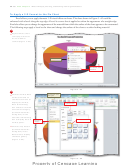 52
52 53
53 54
54 55
55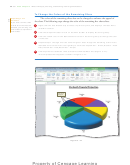 56
56 57
57 58
58 59
59 60
60 61
61 62
62 63
63 64
64 65
65 66
66 67
67 68
68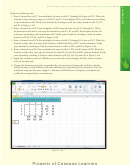 69
69 70
70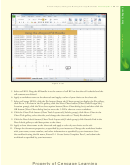 71
71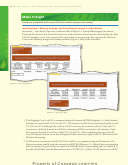 72
72 73
73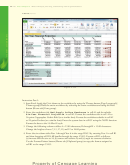 74
74 75
75 76
76 77
77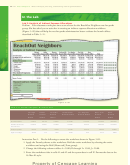 78
78 79
79 80
80 81
81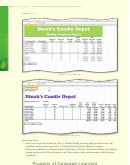 82
82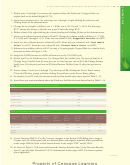 83
83 84
84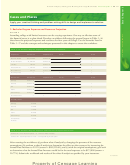 85
85 86
86 87
87What-If Analysis, Charting, and Working with Large Worksheets
Excel Chapter 3
EX 209
was entered and copied to cells D9, D10, and D11. The current IF functions in cells D8, D9, D10,
and D11 are incorrect. Edit and correct the IF function in cell D8. Copy the corrected formula in
cell D8 to cells D9, D10, and D11. After completing the copy, click the Auto Fill Options button
arrow that is displayed below and to the right of cell D11 and choose Fill Without Formatting.
3. The Processing Costs in cell E8 is computed using the formula =B4*B8 (Proc. Costs % × Sales).
The formula in cell E8 was entered and copied to cells E9, E10, and E11. Although the result in
cell E8 is correct, the results in cells E9, E10, and E11 are incorrect. Edit and correct the formula
in cell E8 by changing cell B4 to an absolute cell reference. Copy the corrected formula in cell E8
to cells E9, E10, and E11. After completing the copy, click the Auto Fill Options button arrow that
displays below and to the right of cell E11 and choose Fill Without Formatting. Ensure that the
range B9:E11 is formatted with the Accounting Number format.
4. Change the design of the worksheet by moving the Assumptions table in the range A1:B4 to the
range A14:B17, as shown in Figure 3–86b. To complete the move drag the Assumptions table to
the range A14:B17. Use Figure 3–86b to verify that Excel automatically adjusted the cell references
based on the move. Use the Undo button and Redo button on the Quick Access Toolbar to move
the Assumptions table back and forth while the results of the formulas remain the same.
5. Apply a worksheet name to the sheet tab and apply the Orange, Accent 3 color to the sheet tab.
6. Change the document properties, as specifi ed by your instructor. Change the worksheet header
with your name, course number, and other information as specifi ed by your instructor. Save the
workbook using the fi le name, Make It Right 3-1 SpeedyOffi Annual Projected Net
Income Complete, and submit the revised workbook as specifi ed by your instructor.
In the Lab
Create a workbook using the guidelines, concepts, and skills presented in this chapter. Labs
are listed in order of increasing diffi culty.
Lab 1: Six-Year Financial Projection
Problem: Your supervisor in the Finance department at Med Supply Online Warehouse has asked
you to create a worksheet that will project the annual gross margin, expenses, total expenses, operating
income, income taxes, and net income for the next six years based on the assumptions in Table 3– 9.
The desired worksheet is shown in Figure 3–87 on the following page. In Part 1 you will create the
worksheet. In Part 2 you will create a chart to present the data, shown in Figure 3–88 on page EX 213.
In Part 3 you will use Goal Seek to analyze three different sales scenarios.
Table 3 –9 Med Supply Online Warehouse Financial Projection Assumptions
Units Sold in Prior Year
1,589,712
Unit Cost
$59.50
Annual Sales Growth
4.50%
Annual Price Decrease
3.80%
Margin
38.80%
Continued >
ADVERTISEMENT
0 votes
Related Articles
Related forms


Related Categories
Parent category: Education