What-If Analysis, Charting, And Working With Large Worksheets Page 52
ADVERTISEMENT
 1
1 2
2 3
3 4
4 5
5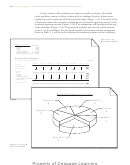 6
6 7
7 8
8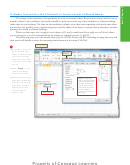 9
9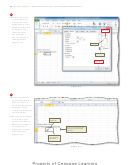 10
10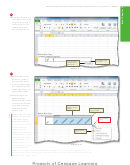 11
11 12
12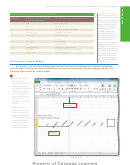 13
13 14
14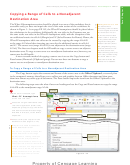 15
15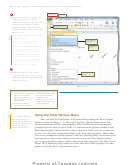 16
16 17
17 18
18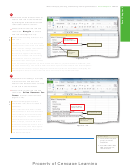 19
19 20
20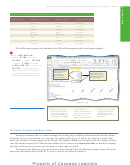 21
21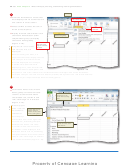 22
22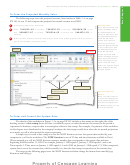 23
23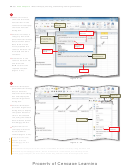 24
24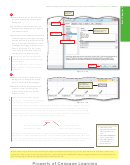 25
25 26
26 27
27 28
28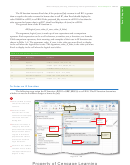 29
29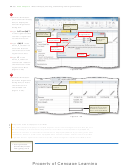 30
30 31
31 32
32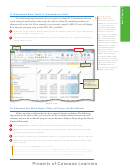 33
33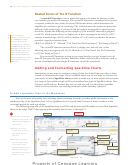 34
34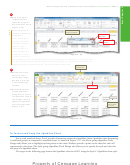 35
35 36
36 37
37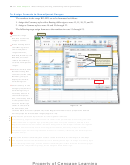 38
38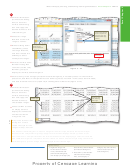 39
39 40
40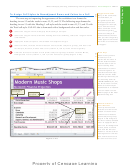 41
41 42
42 43
43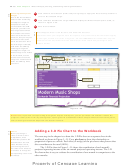 44
44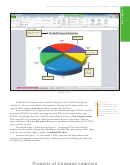 45
45 46
46 47
47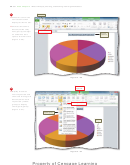 48
48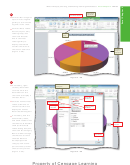 49
49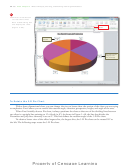 50
50 51
51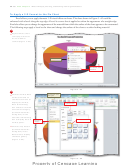 52
52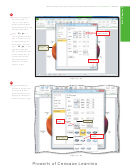 53
53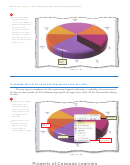 54
54 55
55 56
56 57
57 58
58 59
59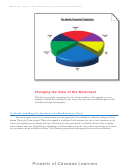 60
60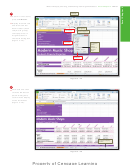 61
61 62
62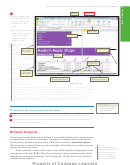 63
63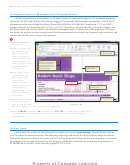 64
64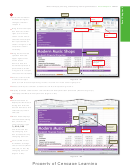 65
65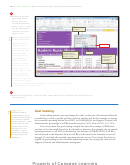 66
66 67
67 68
68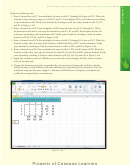 69
69 70
70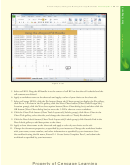 71
71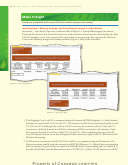 72
72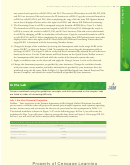 73
73 74
74 75
75 76
76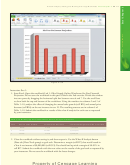 77
77 78
78 79
79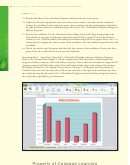 80
80 81
81 82
82 83
83 84
84 85
85 86
86 87
87EX 188
Excel Chapter 3
What-If Analysis, Charting, and Working with Large Worksheets
To Apply a 3-D Format to the Pie Chart
Excel allows you to apply dramatic 3-D visual effects to charts. The chart shown in Figure 3–62 could be
enhanced with a bevel along the top edge. A bevel is a curve that is applied to soften the appearance of a straight edge.
Excel also allows you to change the appearance of the material from which the surface of the chart appears to be constructed.
The following steps apply a bevel to the chart and change the surface of the chart to a softer-looking material.
1
•
Right-click the chart
to display a shortcut
menu and Mini
toolbar (Figure 3 –63).
Mini toolbar
shortcut menu
Format Data Series
command
Figure 3 – 63
2
Format Data Series
•
Click the Format Data
dialog box
Series command on
the shortcut menu to
display the Format
Top bevel button
Data Series dialog
box and then click the
3-D Format category
(Format Data Series
dialog box) on the
left side of the dialog
box to display the 3-D
Circle bevel button
3-D Format
category
Format panel.
•
Click the Top button
(Format Data Series
dialog box) in the
Bevel area to display
the Bevel gallery
(Figure 3 – 64).
Figure 3 – 64
ADVERTISEMENT
0 votes
Related Articles
Related forms


Related Categories
Parent category: Education