What-If Analysis, Charting, And Working With Large Worksheets Page 71
ADVERTISEMENT
 1
1 2
2 3
3 4
4 5
5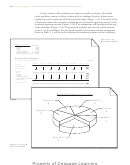 6
6 7
7 8
8 9
9 10
10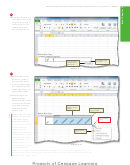 11
11 12
12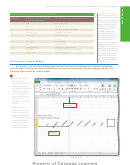 13
13 14
14 15
15 16
16 17
17 18
18 19
19 20
20 21
21 22
22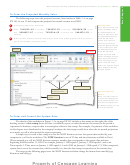 23
23 24
24 25
25 26
26 27
27 28
28 29
29 30
30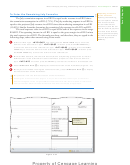 31
31 32
32 33
33 34
34 35
35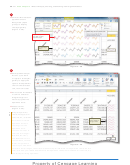 36
36 37
37 38
38 39
39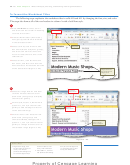 40
40 41
41 42
42 43
43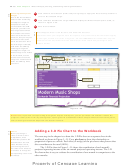 44
44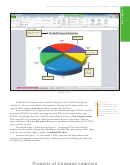 45
45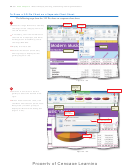 46
46 47
47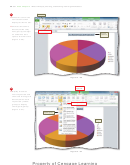 48
48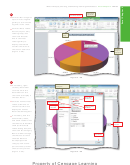 49
49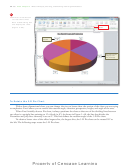 50
50 51
51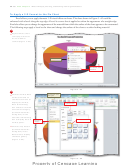 52
52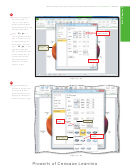 53
53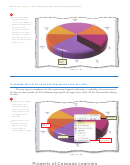 54
54 55
55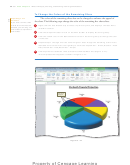 56
56 57
57 58
58 59
59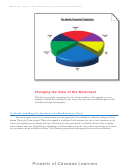 60
60 61
61 62
62 63
63 64
64 65
65 66
66 67
67 68
68 69
69 70
70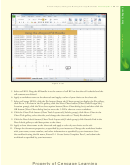 71
71 72
72 73
73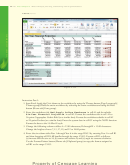 74
74 75
75 76
76 77
77 78
78 79
79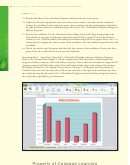 80
80 81
81 82
82 83
83 84
84 85
85 86
86 87
87What-If Analysis, Charting, and Working with Large Worksheets
Excel Chapter 3
EX 207
Figure 3 – 85
5. Select cell K19. Drag the fi ll handle in to the center of cell K19 so that the cell is shaded and the
cell contents are deleted.
6. Apply a worksheet name to the sheet tab and apply a color of your choice to the sheet tab.
7. Select cell range H2:I14, click the Pie button (Insert tab | Charts group) to display the Pie gallery,
click Pie in 3-D chart in the Pie gallery, click the Move Chart button (Chart Tools Design tab |
Location group), click the New sheet option button (Move Chart dialog box), and then click the
OK button (Move Chart dialog box) to move the 3-D Pie chart to a new worksheet.
8. Click the Chart Title button (Chart Tools Layout tab | Labels group), click Above Chart in the
Chart Title gallery, select the title, and change the chart title to “Yearly Breakdown”.
9. Click the Data Labels button (Chart Tools Layout tab | Labels group), click Outside End in the
Data Labels gallery to add data points to the chart.
10. Apply a chart sheet name to the sheet tab and apply a color of your choice to the tab.
11. Change the document properties, as specifi ed by your instructor. Change the worksheet header
with your name, course number, and other information as specifi ed by your instructor. Save
the workbook using the fi le name, Extend 3-1 Create Series Complete Part 2, and submit the
workbook as specifi ed by your instructor.
ADVERTISEMENT
0 votes
Related Articles
Related forms


Related Categories
Parent category: Education