What-If Analysis, Charting, And Working With Large Worksheets Page 55
ADVERTISEMENT
 1
1 2
2 3
3 4
4 5
5 6
6 7
7 8
8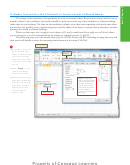 9
9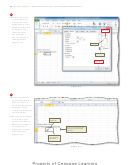 10
10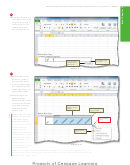 11
11 12
12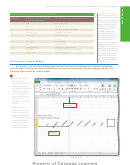 13
13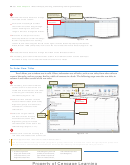 14
14 15
15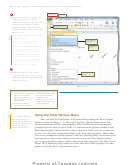 16
16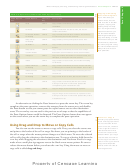 17
17 18
18 19
19 20
20 21
21 22
22 23
23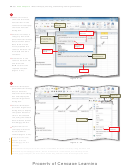 24
24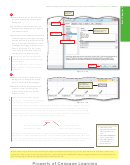 25
25 26
26 27
27 28
28 29
29 30
30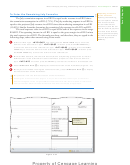 31
31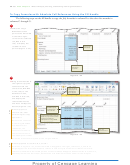 32
32 33
33 34
34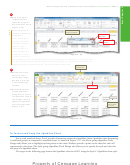 35
35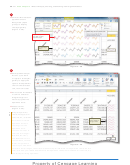 36
36 37
37 38
38 39
39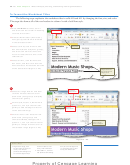 40
40 41
41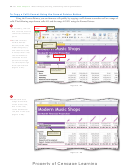 42
42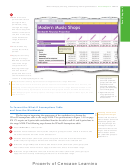 43
43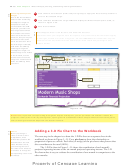 44
44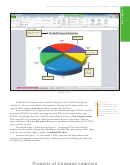 45
45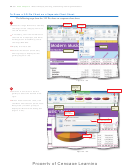 46
46 47
47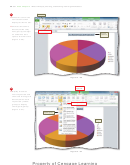 48
48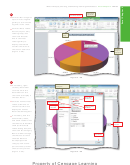 49
49 50
50 51
51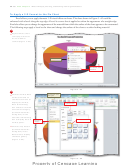 52
52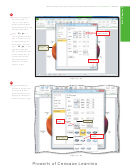 53
53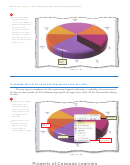 54
54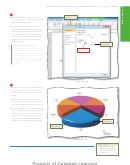 55
55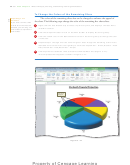 56
56 57
57 58
58 59
59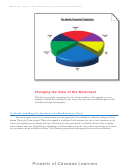 60
60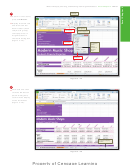 61
61 62
62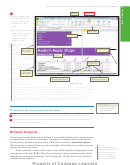 63
63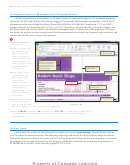 64
64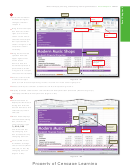 65
65 66
66 67
67 68
68 69
69 70
70 71
71 72
72 73
73 74
74 75
75 76
76 77
77 78
78 79
79 80
80 81
81 82
82 83
83 84
84 85
85 86
86 87
87What-If Analysis, Charting, and Working with Large Worksheets
Excel Chapter 3
EX 191
2
Format Data Point
•
Click Format Data Point on the
dialog box
shortcut menu to display the Format
Data Point dialog box.
•
Drag the Point Explosion slider
(Format Data Point dialog box) to
the right until the Point Explosion
box reads 28% to set how far the
slice in the 3-D Pie chart should be
offset from the rest of the chart
(Figure 3 – 69).
Point Explosion
box reads 28%
Should I offset more slices?
You can offset as many slices as you
Point Explosion
want, but remember that the reason
slider
for offsetting a slice is to emphasize
it. Offsetting multiple slices tends
to reduce the impact on the reader
and reduces the overall size of the
Pie chart.
Figure 3 – 69
3
•
Click the Fill category (Format Data
Point dialog box) on the left side
of the dialog box to display the Fill
panel.
•
Click Solid fi ll to display the Fill
Color area and then click the Color
button to display the Color gallery.
•
Click the Blue color in the Standard
Colors area of the color gallery and
then click the Close button (Format
Data Point dialog box) to change
the color of the selected slice and
August slice
close the dialog box (Figure 3–70).
exploded 28%
August slice color
changed to blue
Figure 3 – 70
Other Ways
1. Right-click slice, click
Shape Fill Color button
arrow on Mini toolbar,
select color
ADVERTISEMENT
0 votes
Related Articles
Related forms


Related Categories
Parent category: Education