What-If Analysis, Charting, And Working With Large Worksheets Page 6
ADVERTISEMENT
 1
1 2
2 3
3 4
4 5
5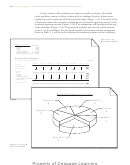 6
6 7
7 8
8 9
9 10
10 11
11 12
12 13
13 14
14 15
15 16
16 17
17 18
18 19
19 20
20 21
21 22
22 23
23 24
24 25
25 26
26 27
27 28
28 29
29 30
30 31
31 32
32 33
33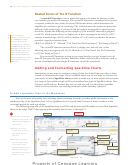 34
34 35
35 36
36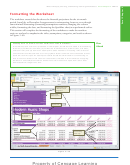 37
37 38
38 39
39 40
40 41
41 42
42 43
43 44
44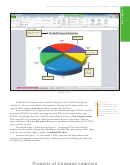 45
45 46
46 47
47 48
48 49
49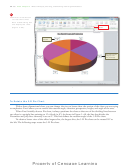 50
50 51
51 52
52 53
53 54
54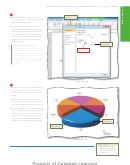 55
55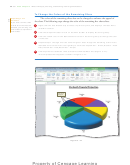 56
56 57
57 58
58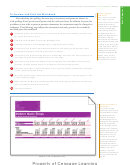 59
59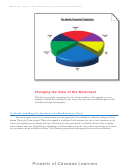 60
60 61
61 62
62 63
63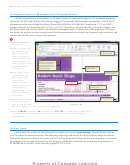 64
64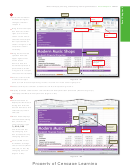 65
65 66
66 67
67 68
68 69
69 70
70 71
71 72
72 73
73 74
74 75
75 76
76 77
77 78
78 79
79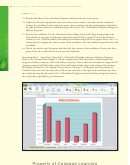 80
80 81
81 82
82 83
83 84
84 85
85 86
86 87
87EX 142
Excel Chapter 3
What-If Analysis, Charting, and Working with Large Worksheets
Using a sketch of the worksheet can help you visualize its design. The sketch
of the worksheet consists of titles, column and row headings, location of data values,
calculations, and a rough idea of the desired formatting (Figure 3 – 3a). The sketch of the
3-D pie chart shows the expected contribution of each month’s operating income to the
six-month operating income (Figure 3 – 3b). The assumptions will be entered at the top
of the worksheet (Figure 3 – 3a). The projected monthly sales revenue will be entered
in row 13 of the worksheet. The projected monthly sales revenue and the assumptions
shown in Table 3 – 1 will be used to calculate the remaining numbers in the worksheet.
Figure 3 –3 (a)
Worksheet Sketch
What-If Assumptions
Bonus
ZZ,ZZZ,ZZ9.00
Commission
Z9.99%
Margin
Z9.99%
Marketing
Z9.99%
Research and Development
Z9.99%
Sales Revenue for Bonus
ZZ,ZZZ,ZZ9.99
Support, General, and Administrative
Z9.99%
Modern Music Shops
Six-Month Financial Projection
99/99/999
Month 1
Month 2
Month 3
Month 4
Month 5
Month 6
Total
Chart
Revenue
$ZZ,ZZZ,ZZ9.99
$ZZ,ZZZ,ZZ9.99
$ZZ,ZZZ,ZZ9.99
$ZZ,ZZZ,ZZ9.99
$ZZ,ZZZ,ZZ9.99
$ZZ,ZZZ,ZZ9.99
$ZZ,ZZZ,ZZ9.99
Cost of Goods Sold
Gross Margin
Expenses
Bonus
$Z,ZZZ,ZZ9.99
$Z,ZZZ,ZZ9.99
$Z,ZZZ,ZZ9.99
$Z,ZZZ,ZZ9.99
$Z,ZZZ,ZZ9.99
$Z,ZZZ,ZZ9.99
$Z,ZZZ,ZZ9.99
Commission
Marketing
Research and Development
Support, General, and Administrative
Total Expenses
$ZZ,ZZZ,ZZ9.99
$ZZ,ZZZ,ZZ9.99
$ZZ,ZZZ,ZZ9.99
$ZZ,ZZZ,ZZ9.99
$ZZ,ZZZ,ZZ9.99
$ZZ,ZZZ,ZZ9.99
$ZZ,ZZZ,ZZ9.99
Operating Income
$ZZ,ZZZ,ZZ9.99
$ZZ,ZZZ,ZZ9.99
$ZZ,ZZZ,ZZ9.99
$ZZ,ZZZ,ZZ9.99
$ZZ,ZZZ,ZZ9.99
$ZZ,ZZZ,ZZ9.99
$ZZ,ZZZ,ZZ9.99
Six-Month Financial Projection
Month 5
Month 4
%
%
Month 6
Month 3
%
%
Month 1
%
Month 2
%
Figure 3 –3 (b) 3-D
Pie Chart Sketch
ADVERTISEMENT
0 votes
Related Articles
Related forms


Related Categories
Parent category: Education