What-If Analysis, Charting, And Working With Large Worksheets Page 36
ADVERTISEMENT
 1
1 2
2 3
3 4
4 5
5 6
6 7
7 8
8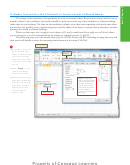 9
9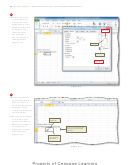 10
10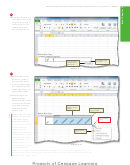 11
11 12
12 13
13 14
14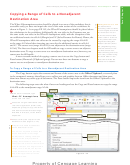 15
15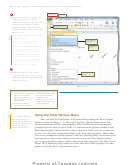 16
16 17
17 18
18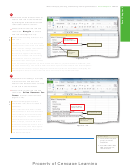 19
19 20
20 21
21 22
22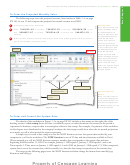 23
23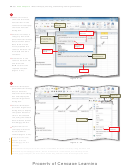 24
24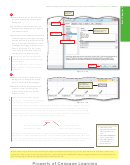 25
25 26
26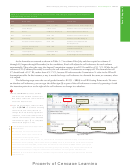 27
27 28
28 29
29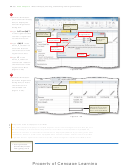 30
30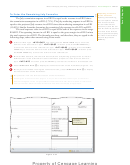 31
31 32
32 33
33 34
34 35
35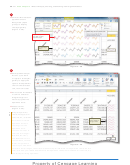 36
36 37
37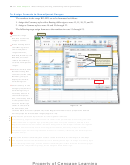 38
38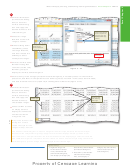 39
39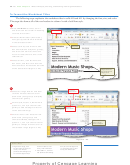 40
40 41
41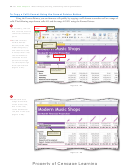 42
42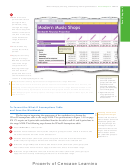 43
43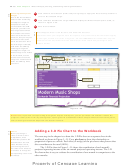 44
44 45
45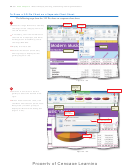 46
46 47
47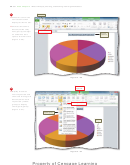 48
48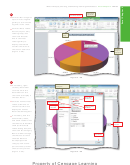 49
49 50
50 51
51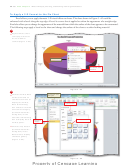 52
52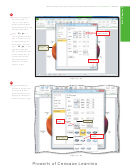 53
53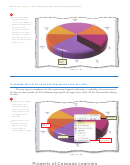 54
54 55
55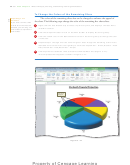 56
56 57
57 58
58 59
59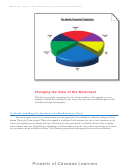 60
60 61
61 62
62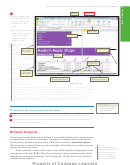 63
63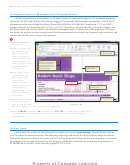 64
64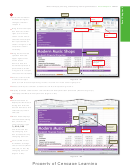 65
65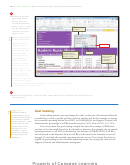 66
66 67
67 68
68 69
69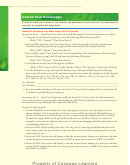 70
70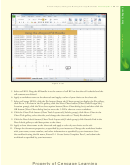 71
71 72
72 73
73 74
74 75
75 76
76 77
77 78
78 79
79 80
80 81
81 82
82 83
83 84
84 85
85 86
86 87
87EX 172
Excel Chapter 3
What-If Analysis, Charting, and Working with Large Worksheets
1
•
Click the More button
(Sparkline Tools
Design tab | Style
group) to display
the Style gallery
(Figure 3 – 38).
Sparkline Style Accent 1,
(no dark or light)
Sparkline style
Sparkline Style
gallery
Figure 3–38
2
•
Click Sparkline Style
Accent 1, (no dark
or light) in the Styles
gallery to apply the
style to the Sparkline
chart in the selected
cell, I13 in this case.
•
Point to the fi ll handle
in cell I13 and then
drag through cell
I25 to copy the Line
Sparkline chart.
•
Select cell I27
(Figure 3 – 39).
Why do Sparkline
charts not appear in
cells I16, I17, and I24?
Line Sparkline
Excel does not draw
chart copied to
range I14:I25
Sparkline charts if
the range for the
Sparkline chart
contains no data. In
this case the ranges
B16:G16, B17:G17,
and B24:G24 do not
contain data, so Excel
draws no Sparkline
Figure 3–39
chart. If you add data
to cells in those ranges, then Excel automatically would draw Line Sparkline charts for the
rows to which you added data because the Sparkline charts were defi ned for cells I16, I17,
and I24 by the drag operation.
ADVERTISEMENT
0 votes
Related Articles
Related forms


Related Categories
Parent category: Education