What-If Analysis, Charting, And Working With Large Worksheets Page 84
ADVERTISEMENT
 1
1 2
2 3
3 4
4 5
5 6
6 7
7 8
8 9
9 10
10 11
11 12
12 13
13 14
14 15
15 16
16 17
17 18
18 19
19 20
20 21
21 22
22 23
23 24
24 25
25 26
26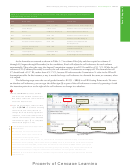 27
27 28
28 29
29 30
30 31
31 32
32 33
33 34
34 35
35 36
36 37
37 38
38 39
39 40
40 41
41 42
42 43
43 44
44 45
45 46
46 47
47 48
48 49
49 50
50 51
51 52
52 53
53 54
54 55
55 56
56 57
57 58
58 59
59 60
60 61
61 62
62 63
63 64
64 65
65 66
66 67
67 68
68 69
69 70
70 71
71 72
72 73
73 74
74 75
75 76
76 77
77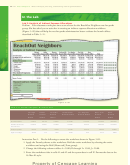 78
78 79
79 80
80 81
81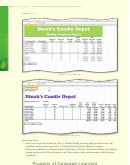 82
82 83
83 84
84 85
85 86
86 87
87EX 220
Excel Chapter 3
What-If Analysis, Charting, and Working with Large Worksheets
continued
In the Lab
17. Remove any Totals in the range B16:F16. Update and add totals as necessary so that totals appear in
the range G16:K16.
18. In cell E8, enter an IF function that applies the following logic and then copy it to the range
E9:E15. If (Current Month Sales – Last Month Sales) / Current Month Sales >= Sales Threshold %,
then Reorder Level + Increase Reorder Amt, otherwise Reorder Level – Decrease Reorder Amt
or =IF((H8-G8)/H8 >= $B$3, D8+$B$1,D8-$B$2).
19. In cell L8, insert a Sparkline Line chart for range G8:H8. Copy cell L8 to the range L9:L16.
20. Unfreeze the worksheet by clicking the Freeze Panes button (View tab | Window group), and then
clicking Unfreeze Panes on the Freeze Panes gallery.
21. Preview the worksheet. Use the Orientation button (Page Layout tab | Page Setup group) to fi t the
printout on one page in landscape orientation.
22. Change the document properties, as specifi ed by your instructor. Change the worksheet header,
adding your name, course number, and other information as specifi ed by your instructor. Save the
workbook.
23. Use the Zoom button (View tab | Zoom group) to change the view of the worksheet. One by one,
select all the percents on the Zoom dialog box. When you are done, return the worksheet to 100%
magnifi cation.
24. Preview the formulas version (ctrl+ ` ) in landscape orientation. Close the worksheet without
saving the latest changes.
25. Submit the workbook as specifi ed by your instructor.
Instructions Part 2:
Start Excel. Open Lab 3-3 Dinah’s Weekly Inventory Report Complete. Do not
save the workbook in this part. Using the numbers in Table 3 –15, analyze the effect of changing the
Sales Threshold in cell B3. The fi rst case should result in a Suggested Reorder in cell E15 of 0. The
second case should result in a Suggested Reorder in cell E15 of 3. Close the workbook without saving
changes. Submit the results of the what-if analysis as specifi ed by your instructor.
Table 3 –15 The Dinah’s Candle Depot’s Sales Threshold Cases
Case
Sales Threshold
1
30%
2
15%
Instructions Part 3:
Submit results for this part as requested by your instructor.
1. Start Excel. Open Lab 3-3 Dinah’s Weekly Inventory Report Complete. Select cell E8. Write down
the formula that Excel displays in the formula bar. Select the range D8:D15. Point to the border
surrounding the range and drag the selection to the range E17:E24. Click cell E8, and write down
the formula that Excel displays in the formula bar below the one you wrote down earlier. Compare
the two formulas. What can you conclude about how Excel responds when you move cells involved
in a formula? Click the Undo button on the Quick Access Toolbar.
2. Right-click the range D8:D15 and then click Delete on the shortcut menu. When Excel displays the
Delete dialog box, click Shift cells left and then click the OK button. What does Excel display in cell
D8? Click cell D8 and then point to the Trace Error button that is displayed to the left of the cell.
Write down the ScreenTip that is displayed. Click the Undo button on the Quick Access Toolbar.
3. Right-click the range D8:D15 and then click Insert on the shortcut menu. When Excel displays the
Insert dialog box, click ‘Shift cells right’ and then click the OK button. What does Excel display in
the formula bar when you click cell F8? What can you conclude about how Excel responds when
you insert cells next to cells involved in a formula? Close the workbook without saving the changes.
ADVERTISEMENT
0 votes
Related Articles
Related forms


Related Categories
Parent category: Education