What-If Analysis, Charting, And Working With Large Worksheets Page 63
ADVERTISEMENT
 1
1 2
2 3
3 4
4 5
5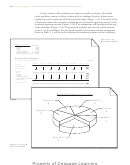 6
6 7
7 8
8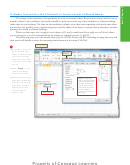 9
9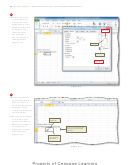 10
10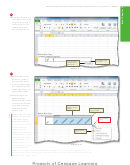 11
11 12
12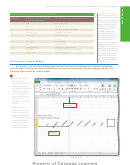 13
13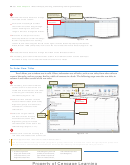 14
14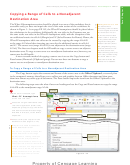 15
15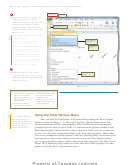 16
16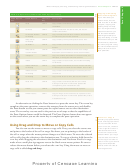 17
17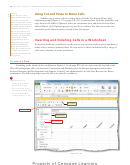 18
18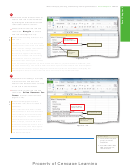 19
19 20
20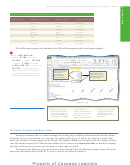 21
21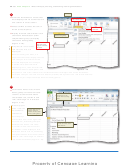 22
22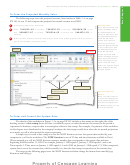 23
23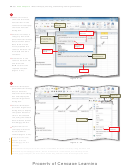 24
24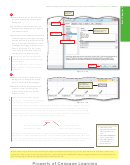 25
25 26
26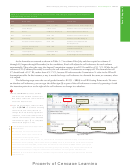 27
27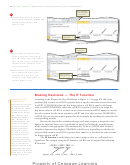 28
28 29
29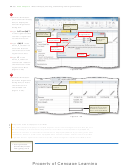 30
30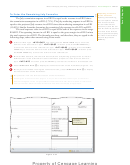 31
31 32
32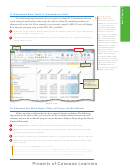 33
33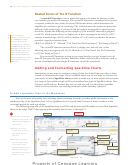 34
34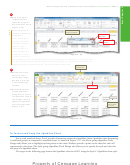 35
35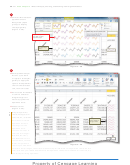 36
36 37
37 38
38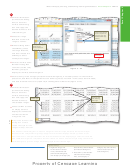 39
39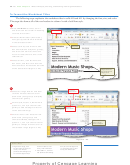 40
40 41
41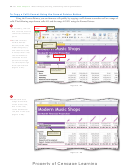 42
42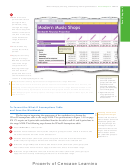 43
43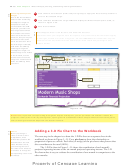 44
44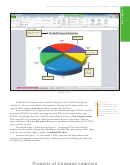 45
45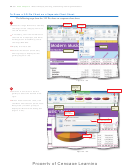 46
46 47
47 48
48 49
49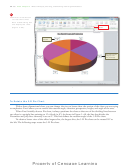 50
50 51
51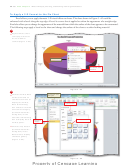 52
52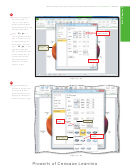 53
53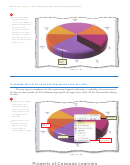 54
54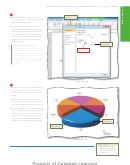 55
55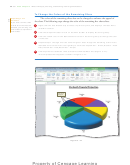 56
56 57
57 58
58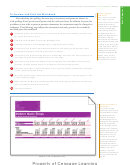 59
59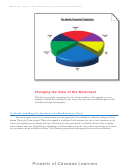 60
60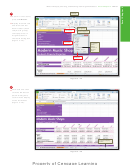 61
61 62
62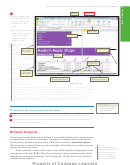 63
63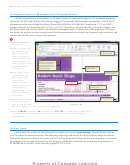 64
64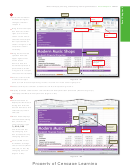 65
65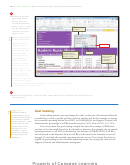 66
66 67
67 68
68 69
69 70
70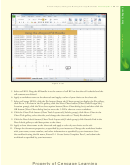 71
71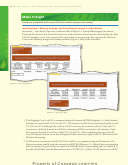 72
72 73
73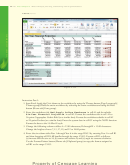 74
74 75
75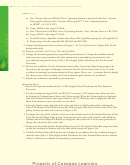 76
76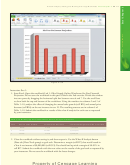 77
77 78
78 79
79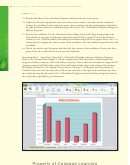 80
80 81
81 82
82 83
83 84
84 85
85 86
86 87
87What-If Analysis, Charting, and Working with Large Worksheets
Excel Chapter 3
EX 199
2
View tab
Split button
•
Click the Split button
(View tab | Window
group) to divide the
window into four
panes.
•
Use the scroll arrows to
Window group
show the four corners
of the worksheet
vertical split bar
at the same time
(Figure 3–79).
What is shown in
the four
scroll bars for top
panes?
upper panes
and bottom panes
move in vertical
synchronization
The four
horizontal
panes in
split bar
Figure 3 –79 are used
to show the following:
(1) range A1:C12 in
scroll bars for left
and right panes
the upper-left pane;
(2) range G1:I12
in the
lower panes
upper-
move in vertical
synchronization
right
pane;
left panes move in
right panes move in
(3) range A19:C24 in
horizontal synchronization
horizontal synchronization
the lower-left pane;
Figure 3 –79
and (4) range G19:I24
in the lower-right pane. The vertical split bar is the vertical bar going up and down the
middle of the window. The horizontal split bar is the horizontal bar going across the middle
of the window. If you use the scroll bars below the window and to the right of the window
to scroll the window, you will see that the panes split by the horizontal split bar scroll
together vertically. The panes split by the vertical split bar scroll together horizontally. To
resize the panes, drag either split bar to the desired location in the window.
Other Ways
1. Drag horizontal split box
and vertical split box to
To Remove the Panes from the Window
desired locations
1
Position the mouse pointer at the intersection of the horizontal and vertical split bars.
2
When the mouse pointer changes to a four-headed arrow, double-click to remove the
four panes from the window.
What-If Analysis
The automatic recalculation feature of Excel is a powerful tool that can be used to analyze
worksheet data. Using Excel to scrutinize the impact of changing values in cells that are
referenced by a formula in another cell is called what-if analysis or sensitivity analysis.
When new data is entered, Excel not only recalculates all formulas in a worksheet but also
Zooming
redraws any associated charts.
You can use the Zoom in
and Zoom out buttons on
In the workbook created in this chapter, many of the formulas are dependent on the
the status bar to zoom
assumptions in the range B2:B8. Thus, if you change any of the assumption values, Excel
from 10% to 400% to
immediately recalculates all formulas. Excel redraws the 3-D Pie chart as well, because it
reduce or enlarge the
is based on these numbers.
display of a worksheet.
ADVERTISEMENT
0 votes
Related Articles
Related forms


Related Categories
Parent category: Education