What-If Analysis, Charting, And Working With Large Worksheets Page 56
ADVERTISEMENT
 1
1 2
2 3
3 4
4 5
5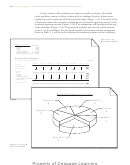 6
6 7
7 8
8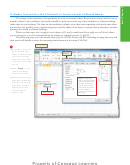 9
9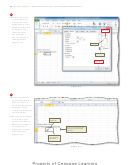 10
10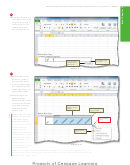 11
11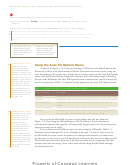 12
12 13
13 14
14 15
15 16
16 17
17 18
18 19
19 20
20 21
21 22
22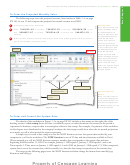 23
23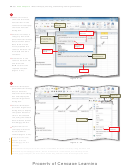 24
24 25
25 26
26 27
27 28
28 29
29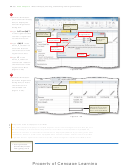 30
30 31
31 32
32 33
33 34
34 35
35 36
36 37
37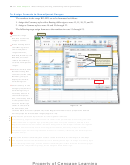 38
38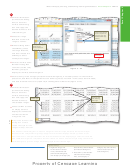 39
39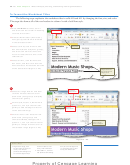 40
40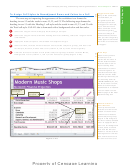 41
41 42
42 43
43 44
44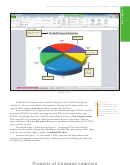 45
45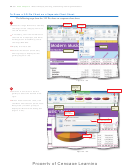 46
46 47
47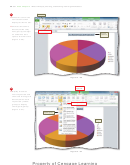 48
48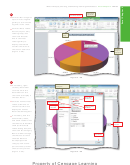 49
49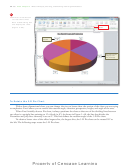 50
50 51
51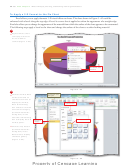 52
52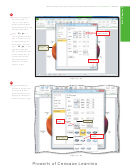 53
53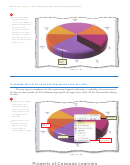 54
54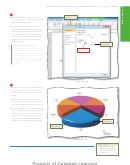 55
55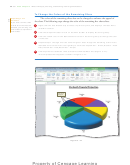 56
56 57
57 58
58 59
59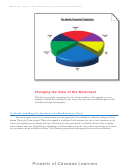 60
60 61
61 62
62 63
63 64
64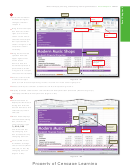 65
65 66
66 67
67 68
68 69
69 70
70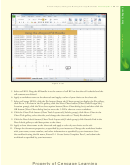 71
71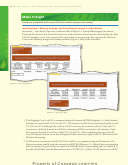 72
72 73
73 74
74 75
75 76
76 77
77 78
78 79
79 80
80 81
81 82
82 83
83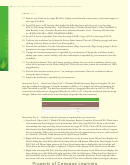 84
84 85
85 86
86 87
87EX 192
Excel Chapter 3
What-If Analysis, Charting, and Working with Large Worksheets
To Change the Colors of the Remaining Slices
Exploding a 3-D
The colors of the remaining slices also can be changed to enhance the appeal of
Pie Chart
the chart. The following steps change the color of the remaining fi ve chart slices.
If you click a 3-D Pie chart
so that all of the slices are
1
Right-click the slice labeled July to select only the July slice, and display a shortcut menu
selected, you can drag one
and Mini toolbar.
of the slices to explode all
of the slices.
2
Click the Shape Fill button arrow on the Mini toolbar to display the Color gallery.
3
Click the Yellow color in the Standard Colors area in the Color gallery to change the color
of the slice.
4
Repeat Steps 1 through 3 for the remaining four slices. Assign the following colors in the
Standard Colors area in the color gallery to each slice: September – Green; October – Dark
Blue; November – Red; December – Purple.
5
Click anywhere outside the chart to deselect the December slice (Figure 3– 71).
The completed chart appears as shown in Figure 3– 71.
slice colors
changed
Figure 3 –71
ADVERTISEMENT
0 votes
Related Articles
Related forms


Related Categories
Parent category: Education