Multi-Year Analysis Plan Page 11
ADVERTISEMENT
 1
1 2
2 3
3 4
4 5
5 6
6 7
7 8
8 9
9 10
10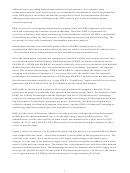 11
11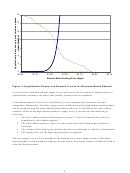 12
12 13
13 14
14 15
15 16
16 17
17 18
18 19
19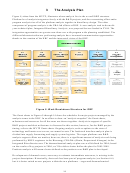 20
20 21
21 22
22 23
23 24
24 25
25 26
26 27
27 28
28 29
29 30
30 31
31 32
32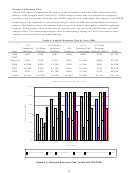 33
33 34
34 35
35 36
36 37
37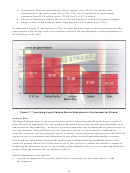 38
38 39
39 40
40 41
41 42
42 43
43 44
44 45
45 46
46 47
47 48
48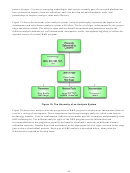 49
49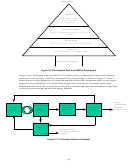 50
50 51
51 52
52 53
53 54
54 55
55 56
56 57
57 58
58 59
59 60
60 61
61 62
62 63
63 64
64 65
65 66
66 67
67 68
68 69
69 70
70 71
71 72
72 73
73 74
74 75
75 76
76 77
77 78
78 79
79 80
80different issues, providing desired improvements as end outcomes. For example, some
technologies improve power grid security by increasing the distribution of electricity production,
while OBP projects can reduce the amount of imported oil used for transportation. Because
differing technologies have differing needs, OBP needs to play a role in determining the
outcomes reported.
PBA sees its role as comparing data (primarily outputs) from all EERE programs on the same
basis and estimating end outcomes based on that data. Therefore, OBP is responsible for
activities, milestones, and output estimates up to the bioindustry analysis and PBA is responsible
for modeling necessary for final outcomes with bioindustry analysis and benefit modeling. The
two groups overlap in the bioindustry (intermediate outcomes) analysis.
Intermediate outcomes are individual market effects of EERE research projects. For
transportation fuels and commodity chemicals, they are market size and should be linked to price
– the calculated output. End outcomes are then calculated using the market sizes.
Often the intermediate outcomes are transparent or reported with the end outcomes because they
are calculated in the National Energy Modeling System (NEMS) or Market Allocation model
(MARKAL). NEMS and MARKAL are based exclusively on least-cost calculations with minimal
modeled regions; therefore, they miss other market drivers including “greenness” and regional
issues. Due to those shortcomings, NEMS and MARKAL underestimate the market sizes of
emerging and minority technologies. To overcome this issue, the market sizes for renewable
technologies are estimated exogenously to NEMS and MARKAL and the results are hard coded
into the macroeconomic models (e.g., using EERE’s “GreenPower” market models for electricity
generation and RYM and ELSAS for E10 blending into the liquid fuel market).
OBP needs to choose which products will be used to estimate the program’s benefits. These
products need to have a potentially high impact on the nations energy future. For example, within
EERE the Vehicle Technologies and the Hydrogen and Fuel Cells Infrastructure Technology
programs use transportation fueled by hydrogen, and the Solar Energy Technology and the Wind
and Hydropower Technologies programs use power. Historically, the Biofuels program used
cellulosic ethanol, the Biopower program used power, and the Office of Industrial Technologies
used energy reductions (natural gas, coal, and others) by bioproducts.
OBP will then need to determine whether or not the currently used specialized biofuels market
models provide adequate demand curves for the high-energy impact products chosen. The
demand curves will be time specific; in other words, one demand curve will be used for 2010,
another for 2015, and a third for 2020. PBA needs to be consulted during development of these
curves to provide input.
Figure 3 shows an example of a hypothetical supply and demand curve for biomass-based ethanol
at an unspecified time point – starch based ethanol is not included in this hypothetical curve. The
solid line is the supply curve and shows how the supply might change as the market price
changes. It is the sum of the feedstock supply curve (converted to gallons of ethanol with a given
process yield) and conversion costs. The dashed line is the demand curve and shows how demand
decreases with the market price. The intersection between the demand curve and the supply curve
for a specific product at a specific time point will indicate the market size. In this case, the market
size is approximately 6.5 MM gal and the market price is approximately $1.40/gal.
7
ADVERTISEMENT
0 votes
Related Articles
Related forms


Related Categories
Parent category: Education