Multi-Year Analysis Plan Page 4
ADVERTISEMENT
 1
1 2
2 3
3 4
4 5
5 6
6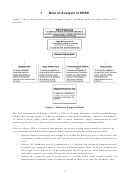 7
7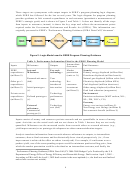 8
8 9
9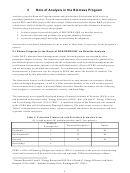 10
10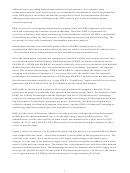 11
11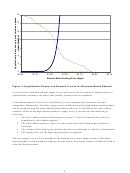 12
12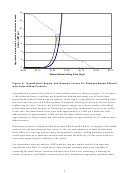 13
13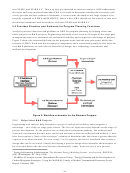 14
14 15
15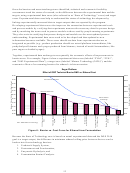 16
16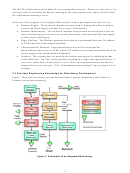 17
17 18
18 19
19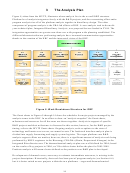 20
20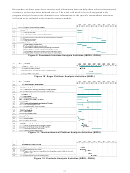 21
21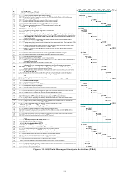 22
22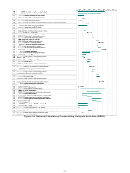 23
23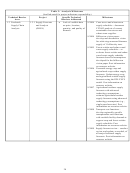 24
24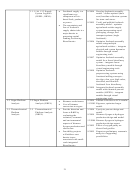 25
25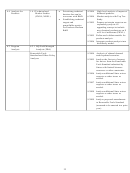 26
26 27
27 28
28 29
29 30
30 31
31 32
32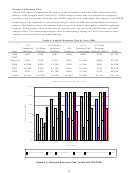 33
33 34
34 35
35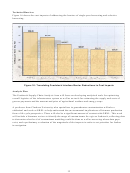 36
36 37
37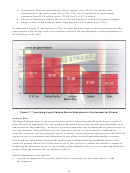 38
38 39
39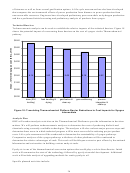 40
40 41
41 42
42 43
43 44
44 45
45 46
46 47
47 48
48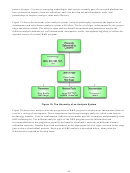 49
49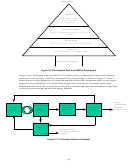 50
50 51
51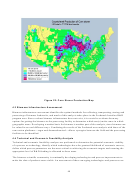 52
52 53
53 54
54 55
55 56
56 57
57 58
58 59
59 60
60 61
61 62
62 63
63 64
64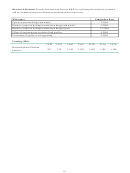 65
65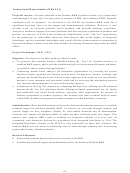 66
66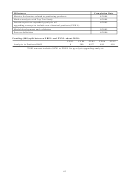 67
67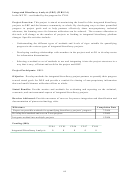 68
68 69
69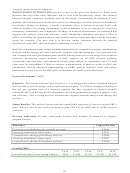 70
70 71
71 72
72 73
73 74
74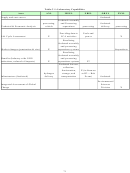 75
75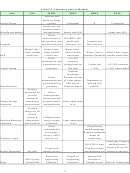 76
76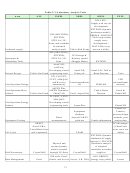 77
77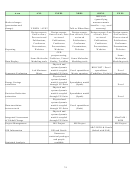 78
78 79
79 80
80List of Tables
Table 1: Performance Information Fitted to the EERE Planning Model......................................... 4
Table 2: Evaluation Framework with Prioritized Evaluation Areas................................................ 6
Table 3: Analysis Milestones ....................................................................................................... 20
Table 4: Analysis Resource Plan by Year (000)............................................................................ 29
Table 5: Feedstock Interface Objectives ....................................................................................... 30
Table 6: Sugar Platform Objectives .............................................................................................. 33
Table 7: Thermochemical Platform Goal and Objectives ............................................................. 35
Table 8: Products Objectives......................................................................................................... 37
Table C-1: Laboratory Capabilities ............................................................................................... 71
Table C-2: Laboratory Analysis Methods ..................................................................................... 72
Table C-3: Laboratory Analysis Tools .......................................................................................... 73
List of Figures
Figure 1: Biomass Program Goals................................................................................................... 3
Figure 2: Logic Model used in EERE Program Planning Guidance ............................................... 4
Figure 3: Hypothetical Supply and Demand Curves for Biomass-Based Ethanol .......................... 8
Figure 4: Hypothetical Supply and Demand Curves for Biomass-Based Ethanol with Value
Added Products ....................................................................................................................... 9
Figure 5: Workflow schematic for the Biomass Program ............................................................. 10
Figure 6: Barrier vs. Cost Curve for Ethanol from Fermentation................................................. 12
Figure 7: Schematic of an Integrated Biorefinery ......................................................................... 13
Figure 8. Work Breakdown Structure for OBP ............................................................................. 16
Figure 9. Feedstock Interface Analysis Activities (INEEL, ORNL)............................................. 17
Figure 10. Sugar Platform Analysis Activities (NREL)................................................................ 17
Figure 11. Thermochemical Platform Analysis Activities (NREL) .............................................. 17
Figure 12. Products Analysis Activities (NREL, PNNL).............................................................. 17
Figure 13. HQ/Field Managed Analysis Activities (PBA)............................................................ 18
Figure 14. National Laboratory Crosscutting Analysis Activities (NREL) .................................. 19
Figure 15: Analysis Resource Plan, Totals for FY04-FY08 ........................................................ 29
Figure 16: Translating Feedstock Interface Barrier Reductions to Cost Impacts.......................... 32
Figure 17: Translating Sugar Platform Barrier Reductions to Cost Impacts for Ethanol.............. 34
Figure 18: Translating Thermochemical Platform Barrier Reductions to Cost Impacts for Syngas
Intermediate........................................................................................................................... 36
Figure 19: The Hierarchy of an Analysis System.......................................................................... 45
Figure 20: The Analysis Path from R&D to Deployment ............................................................. 46
Figure 21: The Iterative Nature of Analysis.................................................................................. 46
Figure 22: Corn Stover Production Map ....................................................................................... 48
ii
ADVERTISEMENT
0 votes
Related Articles
Related forms


Related Categories
Parent category: Education