Multi-Year Analysis Plan Page 8
ADVERTISEMENT
 1
1 2
2 3
3 4
4 5
5 6
6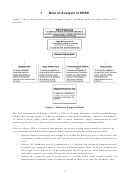 7
7 8
8 9
9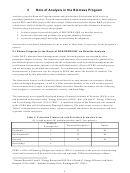 10
10 11
11 12
12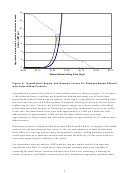 13
13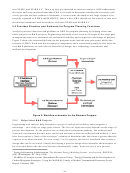 14
14 15
15 16
16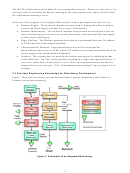 17
17 18
18 19
19 20
20 21
21 22
22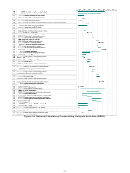 23
23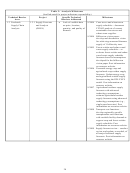 24
24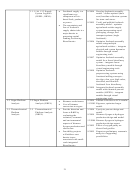 25
25 26
26 27
27 28
28 29
29 30
30 31
31 32
32 33
33 34
34 35
35 36
36 37
37 38
38 39
39 40
40 41
41 42
42 43
43 44
44 45
45 46
46 47
47 48
48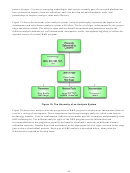 49
49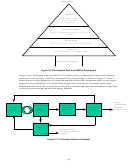 50
50 51
51 52
52 53
53 54
54 55
55 56
56 57
57 58
58 59
59 60
60 61
61 62
62 63
63 64
64 65
65 66
66 67
67 68
68 69
69 70
70 71
71 72
72 73
73 74
74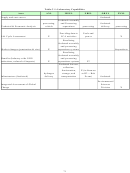 75
75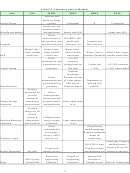 76
76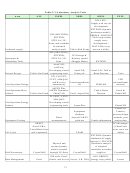 77
77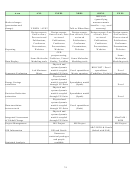 78
78 79
79 80
80These targets are synonymous with output targets in EERE’s program planning logic diagram,
which EERE has followed for the last several years. The logic diagram for program planning
provides guidance to link research expenditures to end outcomes (quantitative measurements of
EERE’s strategic goals) and is shown in Figure 2 and Table 1. It does not identify all the steps
from inputs to outcomes; instead, it shows the key steps and reflects the measurement points
required under the Government Performance and Results Act (GPRA). This information was
1
originally presented in EERE’s “Performance Planning Guidance (GPRA Data Call)” document
.
Figure 2: Logic Model used in EERE Program Planning Guidance
Table 1: Performance Information Fitted to the EERE Planning Model
Intermediate
Inputs
Milestones
Outputs
End Outcomes
Outcomes
EERE
Internal
For each
Market
Security
expenditures
Milestones
technology:
penetration
Primary energy displaced (trillion Btu)
(millions $)
(units or %)
Petroleum displaced (million barrels)
Research advances
Year
Natural gas displaced (billion cubic feet)
Other gov’t
(tbd)
technology
Net
Electricity displaced (billion kWh)
expenditures
introduced
consumer
Coal displaced (million short tons)
(millions $)
Initial prototypes
into market
investment
Other energy displaced (trillion Btu)
(#)
(millions $)
Peak load reduction (megawatts)
Private sector
Technology
Environment
expenditures
Refined prototypes
performance
Emission reductions (MMT carbon, NO
,
x
(millions $)
(#)
(tbd)
SO
, PM, VOCs, CO)
x
Economy
External
Technology
Energy cost savings (millions $)
milestones
cost (tbd)
Non-energy cost savings (millions $)
Commercial
Net economic benefit (millions $)
prototype (#)
Inputs consist of money and resources put into research and are quantifiable in terms of money
spent. Activities are the actual work and are not shown in Table 1 because they are not easily
quantified. Milestones are the measured results from research either as research advances (e.g.,
yield improvements) or as prototype development or other commercialization targets.
Analysis translates information from research advance milestones to outputs, to intermediate
outcomes, then to final outcomes and has historically been viewed prospectively (i.e., if one
improvement is achieved the affect on others is analyzed). For example, if a milestone were a
product yield, one of the corresponding outputs would be minimum product selling price, from
which the market penetration could be calculated as an intermediate outcome, and finally the
1
Performance Planning Guidance (GPRA Data Call) FY 2004-2008 Budget Cycle. Produced by the U.S.
Department of Energy Office of Energy Efficiency and Renewable Energy. Draft version. April 1, 2002. –
According to PBA staff, the April 1, 2002 draft version is the most updated (i.e., the draft was not finalized
and no later version was written).
4
ADVERTISEMENT
0 votes
Related Articles
Related forms


Related Categories
Parent category: Education