Multi-Year Analysis Plan Page 12
ADVERTISEMENT
 1
1 2
2 3
3 4
4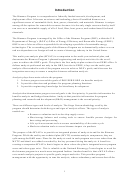 5
5 6
6 7
7 8
8 9
9 10
10 11
11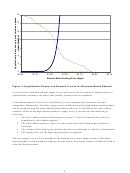 12
12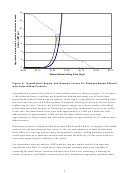 13
13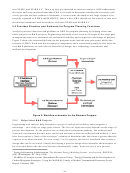 14
14 15
15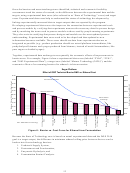 16
16 17
17 18
18 19
19 20
20 21
21 22
22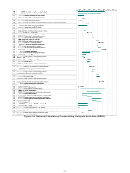 23
23 24
24 25
25 26
26 27
27 28
28 29
29 30
30 31
31 32
32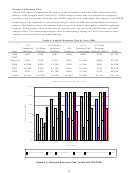 33
33 34
34 35
35 36
36 37
37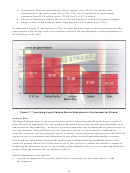 38
38 39
39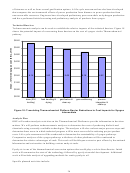 40
40 41
41 42
42 43
43 44
44 45
45 46
46 47
47 48
48 49
49 50
50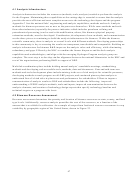 51
51 52
52 53
53 54
54 55
55 56
56 57
57 58
58 59
59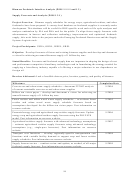 60
60 61
61 62
62 63
63 64
64 65
65 66
66 67
67 68
68 69
69 70
70 71
71 72
72 73
73 74
74 75
75 76
76 77
77 78
78 79
79 80
8014
12
10
8
6
4
2
0
$0.90
$1.10
$1.30
$1.50
$1.70
$1.90
$2.10
Ethanol Market Selling Price ($/gal)
Figure 3: Hypothetical Supply and Demand Curves for Biomass-Based Ethanol
A set of tools to link demand and supply curves will need to be developed so that market sizes
(intermediate outcomes) for each of the primary products can be estimated.
Value-added products will not be used directly in environmental and economic outcome
estimations. Instead they will alter supply curves so that more of the high-impact model product
can be produced with the value-added product than without it. To determine the value-added
product’s effect on the high-impact product’s supply curve, a process like the following is
necessary:
1. The value-added product is determined (or steps 2-3 can be estimated for a class or
hypothetical value-added product).
2. The value-added product’s affect on conversion costs of the high-impact product is
estimated.
3. The volume of the high-impact product that the cost reduction is valid for is determined.
4. The supply curve for the high-impact product is adjusted.
The new supply curve will be matched to the demand curve and a larger volume of the high-
impact product will be produced at the given time points. The larger volume will then be used to
calculate final outcomes.
8
ADVERTISEMENT
0 votes
Related Articles
Related forms


Related Categories
Parent category: Education