Multi-Year Analysis Plan Page 33
ADVERTISEMENT
 1
1 2
2 3
3 4
4 5
5 6
6 7
7 8
8 9
9 10
10 11
11 12
12 13
13 14
14 15
15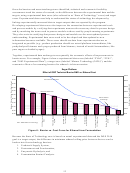 16
16 17
17 18
18 19
19 20
20 21
21 22
22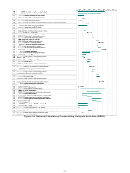 23
23 24
24 25
25 26
26 27
27 28
28 29
29 30
30 31
31 32
32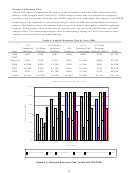 33
33 34
34 35
35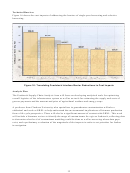 36
36 37
37 38
38 39
39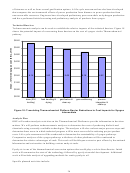 40
40 41
41 42
42 43
43 44
44 45
45 46
46 47
47 48
48 49
49 50
50 51
51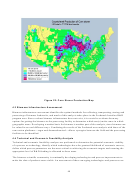 52
52 53
53 54
54 55
55 56
56 57
57 58
58 59
59 60
60 61
61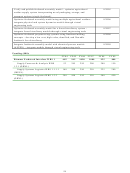 62
62 63
63 64
64 65
65 66
66 67
67 68
68 69
69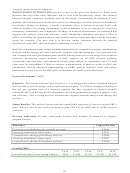 70
70 71
71 72
72 73
73 74
74 75
75 76
76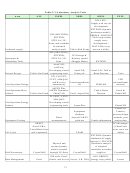 77
77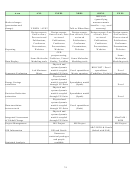 78
78 79
79 80
80Resource Allocation Plan
Table 4 and Figure 15 summarize the resource plan for analysis across the OBP. About half of the
analysis in the program analysis area (6.2) is PBA analysis whose aim is to integrate the program’s
outcomes with the outcomes from the other EERE programs and technologies that compete with EERRE
technologies. The remainder is crosscutting analysis, which includes subcontract funds for analysis
support. This funding allows the analysis teams to get extra help on short notice to handle unplanned
requests. Using contract funds in this way has proven to be very successful and efficient in the OBP
analysis effort. The crosscutting analysis effort is undergoing a change in FY05 to incorporate more
strategic analysis to help in program planning.
Table 4: Analysis Resource Plan by Year (000)
1.0
3.0 Thermo-
6.2.2
6.2.1 HQ
Feedstock
2.0 Sugar
chemical
4.0
National Lab
Program
Year
Interface
Platform
Platform
Products
Crosscutting
Analysis (PBA)
Total
2004
$602
$150
$507
$300
$400
$750
$2,709
2005
(request)
$945
$300
$728
$497
$1,600
$660
$4,230
2006
$1,090
$500
$1,100
$450
$1,100
$660
$4,900
2007
$1,000
$300
$1,100
$450
$1,100
$720
$4,670
2008
$925
$300
$1,100
$450
$1,100
$720
$4,595
Total
$4,562
$1,550
$4,535
$2,147
$4,800
$3,510
$21,104
Analysis Resource Plan FY04 - FY08
$1,200
$1,000
$800
$600
$400
$200
$0
FY04
FY05
FY06
FY07
FY08
Fiscal Year
Feedstock Interface
Sugar
Thermochemical
Products
National Lab Crosscutting
PBA
Figure 15: Analysis Resource Plan, Totals for FY04-FY08
29
ADVERTISEMENT
0 votes
Related Articles
Related forms


Related Categories
Parent category: Education