Multi-Year Analysis Plan Page 13
ADVERTISEMENT
 1
1 2
2 3
3 4
4 5
5 6
6 7
7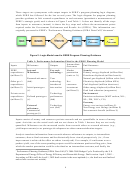 8
8 9
9 10
10 11
11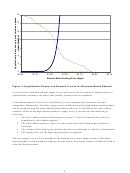 12
12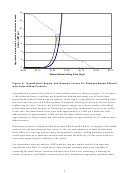 13
13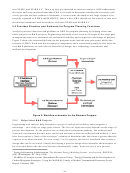 14
14 15
15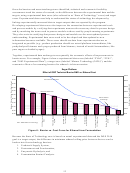 16
16 17
17 18
18 19
19 20
20 21
21 22
22 23
23 24
24 25
25 26
26 27
27 28
28 29
29 30
30 31
31 32
32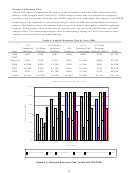 33
33 34
34 35
35 36
36 37
37 38
38 39
39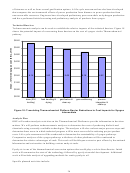 40
40 41
41 42
42 43
43 44
44 45
45 46
46 47
47 48
48 49
49 50
50 51
51 52
52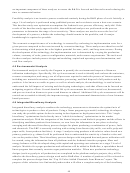 53
53 54
54 55
55 56
56 57
57 58
58 59
59 60
60 61
61 62
62 63
63 64
64 65
65 66
66 67
67 68
68 69
69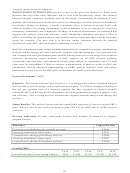 70
70 71
71 72
72 73
73 74
74 75
75 76
76 77
77 78
78 79
79 80
8014
12
10
8
6
4
2
0
$0.90
$1.10
$1.30
$1.50
$1.70
$1.90
$2.10
Ethanol Market Selling Price ($/gal)
Figure 4: Hypothetical Supply and Demand Curves for Biomass-Based Ethanol
with Value Added Products
A hypothetical example of the effects of value-added products is shown in Figure 4. As in Figure
3, the dashed and heavy solid lines are hypothetical demand and supply curves for the high-
impact model product (biomass-based ethanol). In this figure, a hypothetical value-added product
that can reduce the price of 8 million gallons of ethanol by $0.05/gal is shown by the left-shifted
(lighter) supply curve. Likewise, the far left (lightest) supply curve shows another value-added
product that can reduce the price of 500,000 gal of ethanol by an additional cent or so per gallon.
In this case, the ethanol market size went from approximately 6.5 MM gal without the value
added products to approximately 8 MM gal and the ethanol market price went from
approximately $1.40/gal without the value added products to approximately $1.35 with the value-
added products.
Bioindustry modules could potentially be put into NEMS and MARKAL to integrate value-added
products into the calculation process; however, the size and complexity of those models make
them difficult to converge with too many unconstrained variables. Adding bioindustry modules
would open them up to additional variables and increase the difficulty of conversion while not
necessarily improving the credibility of the results.
For intermediate outcome analysis, OBP could develop new market models with input and
consultation from PBA. As stated above, large national economic models are incapable of
estimating the small market variations that take place when a new technology is entering the
market. In the past, small market variations have been determined exogenously and hard-coded
9
ADVERTISEMENT
0 votes
Related Articles
Related forms


Related Categories
Parent category: Education