Multi-Year Analysis Plan Page 57
ADVERTISEMENT
 1
1 2
2 3
3 4
4 5
5 6
6 7
7 8
8 9
9 10
10 11
11 12
12 13
13 14
14 15
15 16
16 17
17 18
18 19
19 20
20 21
21 22
22 23
23 24
24 25
25 26
26 27
27 28
28 29
29 30
30 31
31 32
32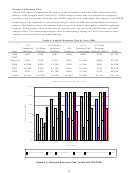 33
33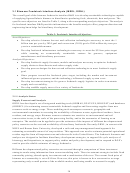 34
34 35
35 36
36 37
37 38
38 39
39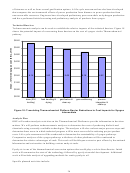 40
40 41
41 42
42 43
43 44
44 45
45 46
46 47
47 48
48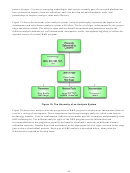 49
49 50
50 51
51 52
52 53
53 54
54 55
55 56
56 57
57 58
58 59
59 60
60 61
61 62
62 63
63 64
64 65
65 66
66 67
67 68
68 69
69 70
70 71
71 72
72 73
73 74
74 75
75 76
76 77
77 78
78 79
79 80
80•
Security
o Primary energy displaced (trillion Btu)
o Petroleum displaced (million barrels)
o Natural gas displaced (billion cubic feet)
o Electricity displaced (billion kWh)
o Coal displaced (million short tons)
o Other energy displaced (trillion Btu)
o Peak load reduction (megawatts)
Possible criteria for economic, environmental, and security benefits were included in the GPRA data call
but knowledge benefits were not because they are not well enough defined. The security criteria will
likely change from quantified savings (as listed above) to those that deal with security upsets to the
country. The standard approaches to quantifying upsets include probability of potential occurrences,
severity of potential occurrences, duration of the potential occurrences, and time to recover following an
occurrence.
The biomass program needs to choose which products will be used to estimate the program’s benefits.
These products need to have a potentially high impact on the nations energy future. For example, within
EERE the Vehicle Technologies and the Hydrogen and Fuel Cells Infrastructure Technology programs
use transportation fueled by hydrogen, and the Solar Energy Technology and the Wind and Hydropower
Technologies programs use power. Historically, the Biofuels program used cellulosic ethanol, the
Biopower program used power, and the Office of Industrial Technologies used energy reductions (natural
gas, coal, and others) by bioproducts.
For each product, the program needs to provide feedstock cost curves and conversion information. The
feedstock cost curves provide the costs of biomass at different market sizes so that the macroeconomic
models can vary the product prices depending upon the market size. Conversion information does not
vary by feedstock market size but over time as technology is predicted to change. The necessary
conversion information is 1) feedstock rate to a single conversion facility, 2) annual product production
rate of that facility, 3) total project investment, 4) annual non-feedstock raw material cost, 5) annual waste
disposal costs, 6) annual fixed costs, 7) other product yields (e.g., electricity), and 8) on-line time.
Life cycle assessments are used to investigate showstoppers (like farming sustainability) and to quantify
changes for benefit modeling. Benefit models like NEMS only calculate market sizes for products within
the energy sector so they require additional information from LCAs to report environmental benefits. All
emission reduction calculations from benefit models require life cycle assessment results on the products
within the product slate. Since much of that information has not been available, all emissions have been
considered negligible for renewable energy sources. That technique has reduced the benefits estimated for
ethanol in the past because ethanol derived from corn starch is assumed to have the same emissions
characteristics as ethanol derived from biomass; whereas, life cycle assessments have shown that ethanol
derived from biomass has lower emissions than that derived from corn starch. Beginning with the
FY2005 budget, life-cycle data from the GREET model has been used to quantify the benefits of ethanol
from corn grain and ethanol from biomass. That data will improve the outcomes produced by the Biomass
Program reported in the annual GPRA data.
4.8.2 Intermediate Outcomes
Intermediate outcomes are individual market effects of EERE research projects. For transportation fuels
and commodity chemicals, they are the market size and should be linked to price – the calculated output.
End outcomes are then calculated using the market sizes.
53
ADVERTISEMENT
0 votes
Related Articles
Related forms


Related Categories
Parent category: Education